Key Takeaways
- Bitcoin’s price trades near $79,715 on Sept. 5 with $80,000 standing in the bulls’ way.
- Bitcoin’s 13 MA bullish signals keep the daily trend positive as short-term momentum cools.
- Bitcoin needs to defend $78,500 and reclaim $80,000 per unit to put $82,281 back in play.
Bitcoin’s 1-Hour Coil Puts $80,000 Squarely in the Spotlight
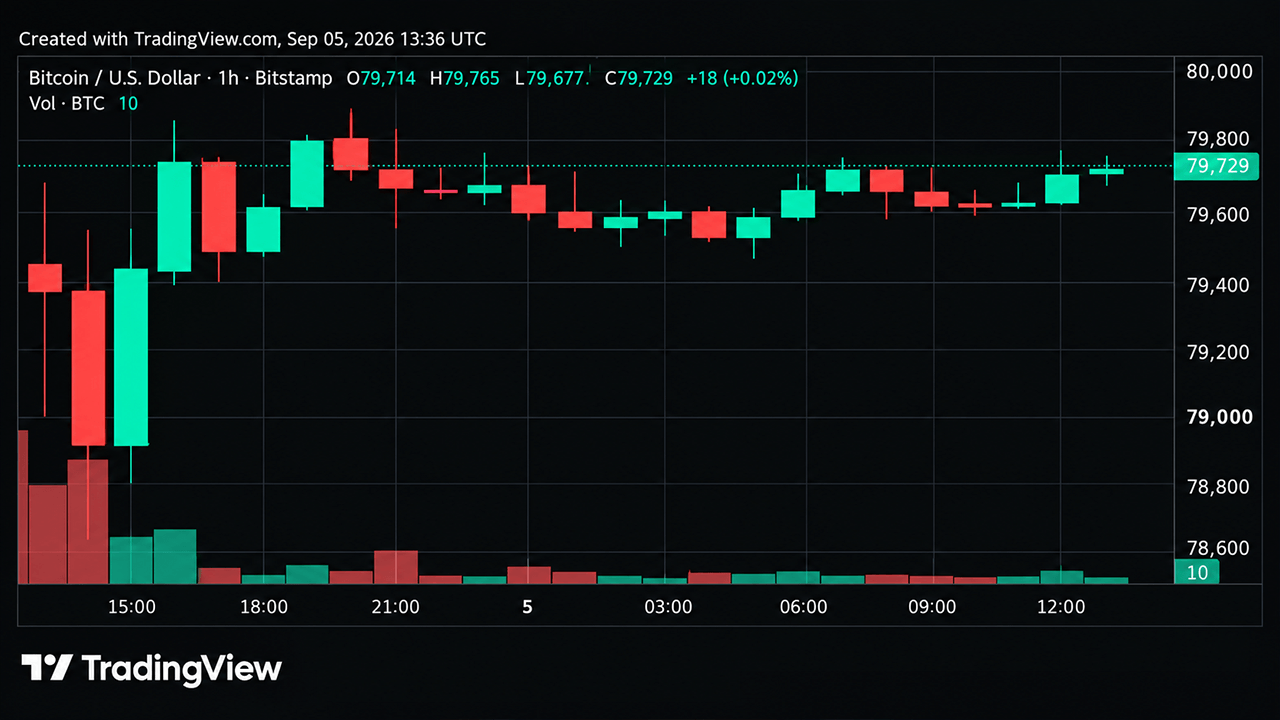
On Saturday, the 1-hour bitcoin price chart shows BTC shifting from a wild ride into a tight waiting game. Bitcoin came out swinging into a wick at $82,281 before a large red candle and the session’s volume spike put the brakes on the move. Buyers bounced back, but the recovery stalled below $80,000, as candles tightened around the $79,500-$79,800 range.
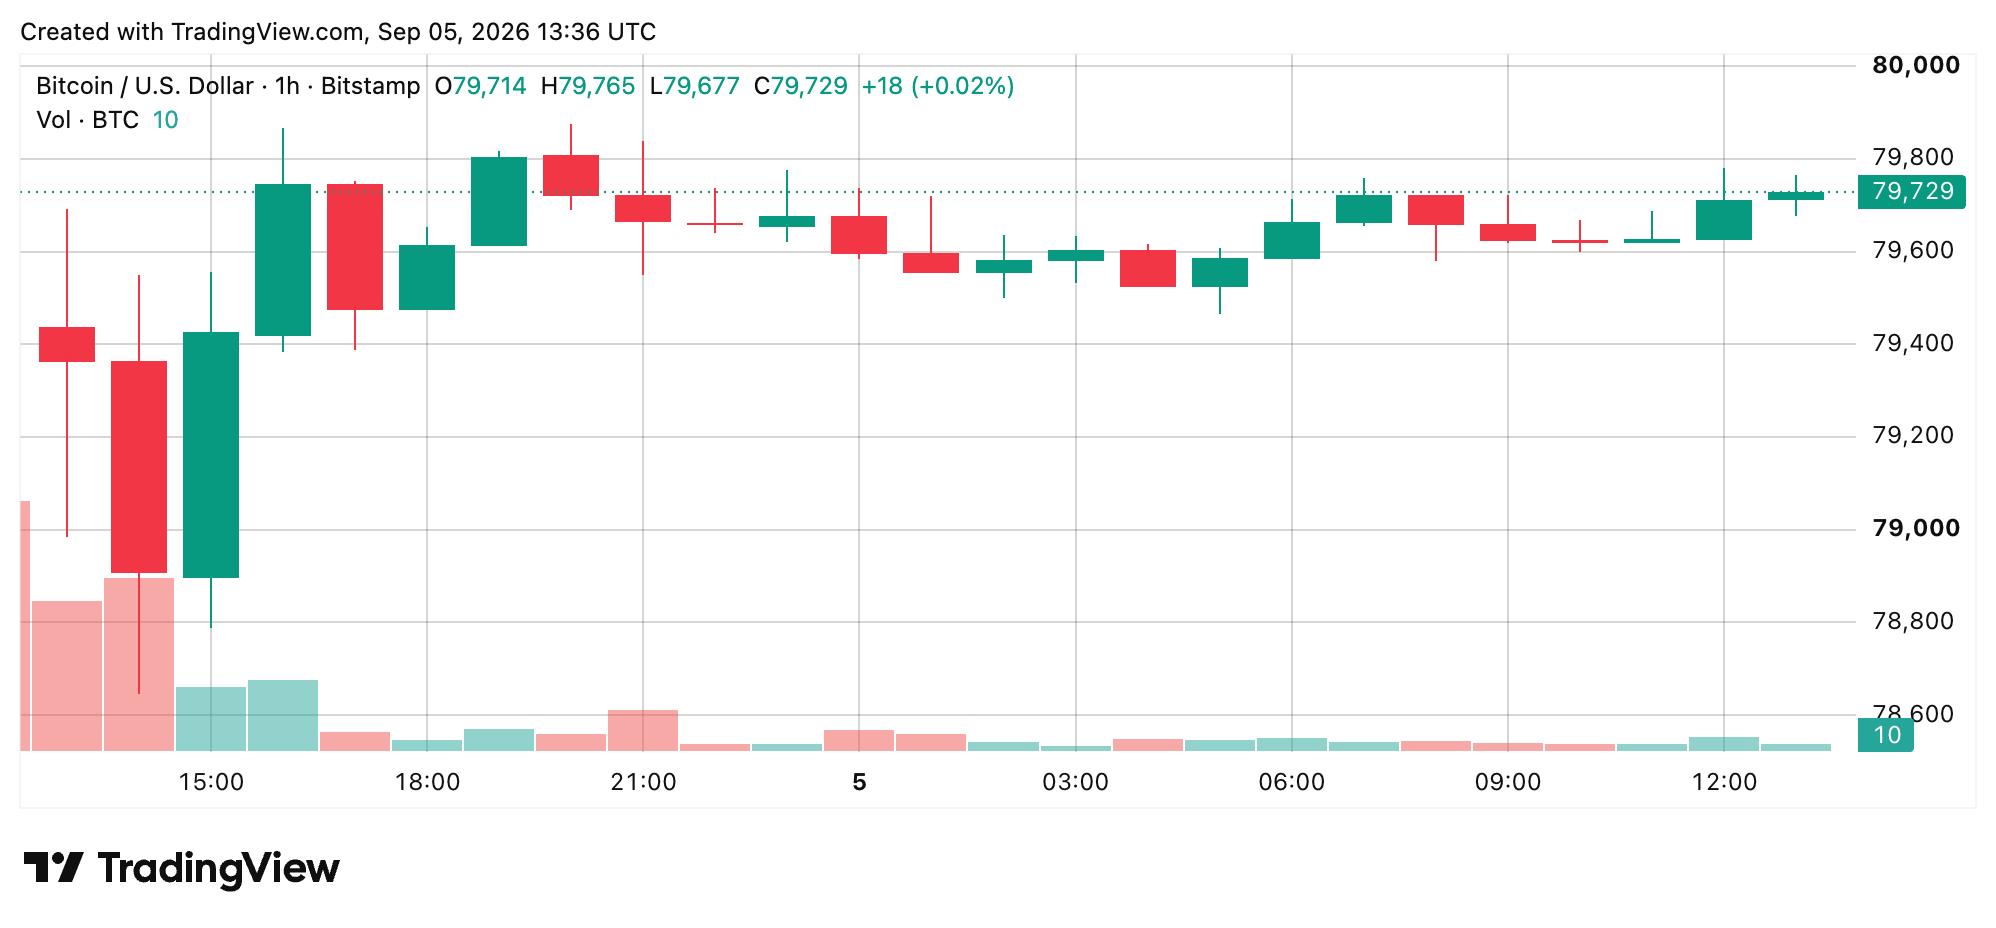
A great deal now hinges on the $79,500 zone, especially with bids thinning below that area and asks stacking from $80,000 into the low $82,000s.
Holding $79,500 and pushing through $80,000 puts $81,000-$81,500 in the cards. On the flip side, a 1-hour close below $79,200 exposes $78,700, while a break of $79,500 brings the $78,700-$78,500 pocket into focus.
Bitcoin’s 4-Hour Momentum Is Running Out of Steam
The 4-hour chart makes bitcoin’s price momentum reset hard to miss. The rally from the high $77,000s into $82,000 territory kicks into high gear before a high-volume rejection puts the brakes on buyers and sends BTC grinding toward $79,500-$80,000. The 4-hour relative strength index (RSI) moves above 70 around the high and cools into the low 50s on some Sept. 4 readings.
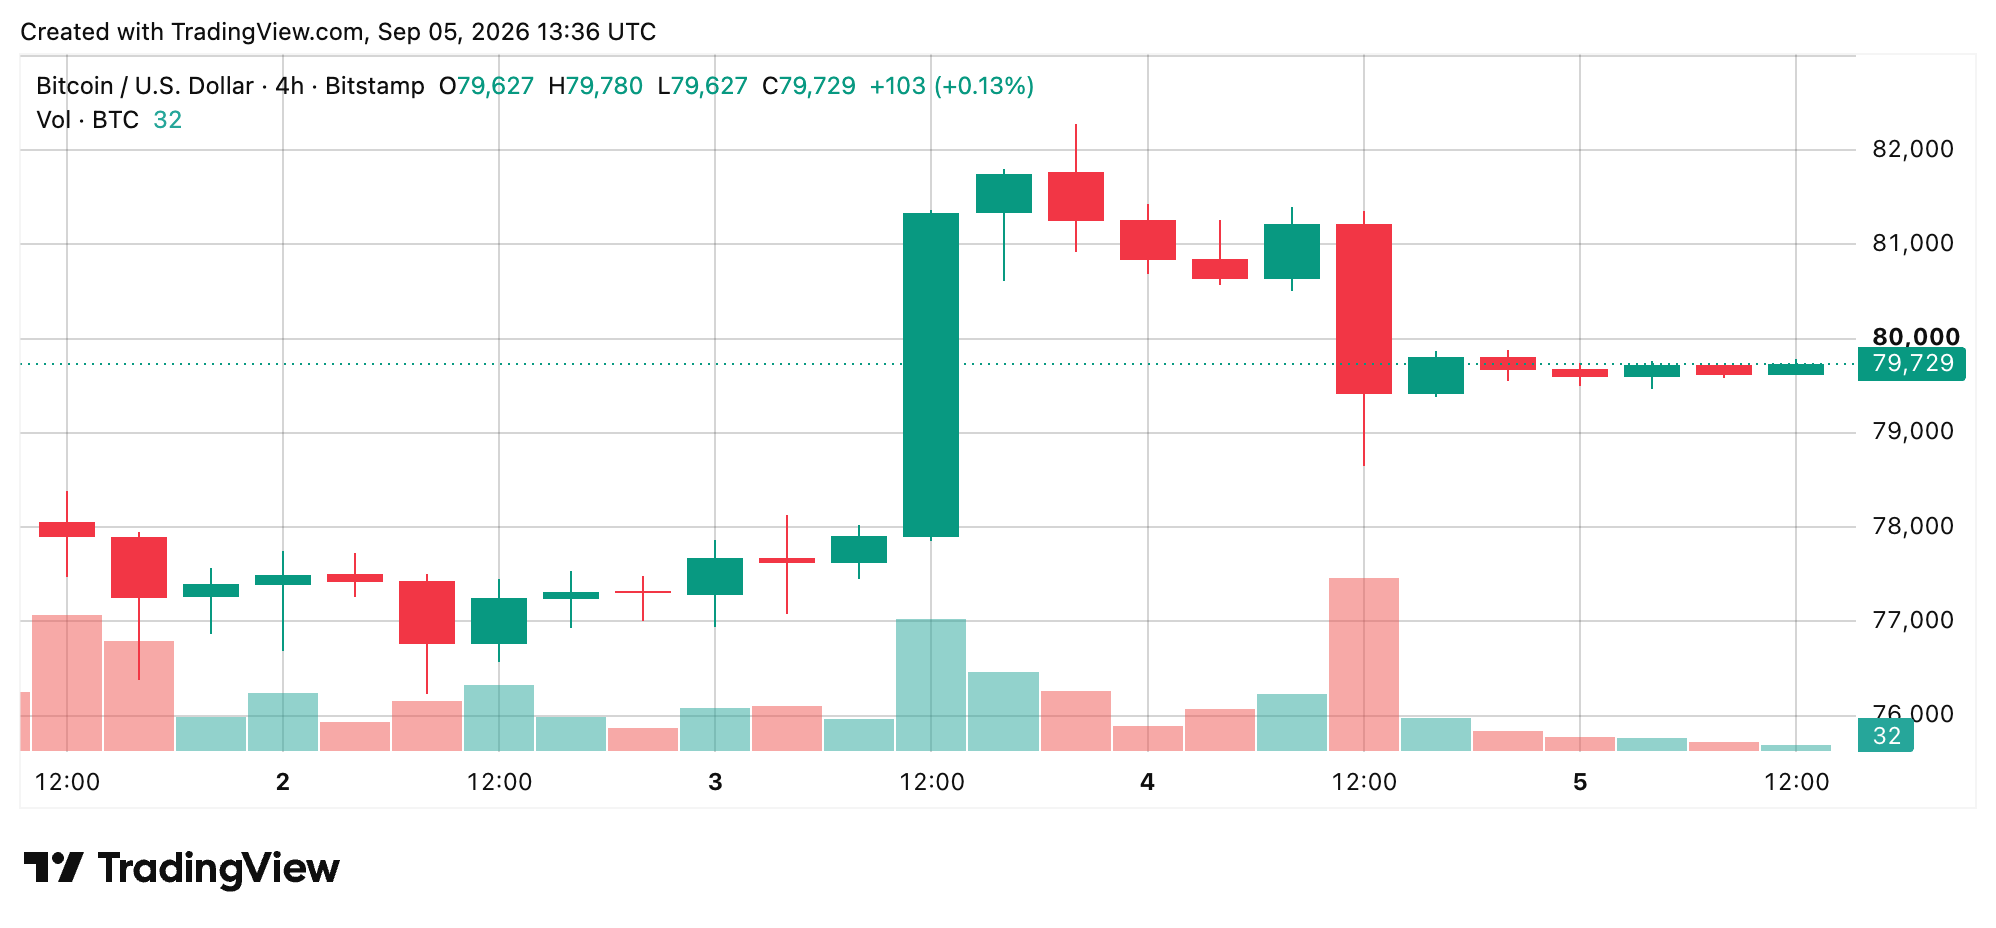
What’s interesting is that the cooling represents a momentum reset rather than a completed trend reversal. This weekend, bitcoin is low-key walking a tightrope inside a $78,500-$82,300 range. Holding $78,500-$79,100 and reclaiming $80,000, followed by $81,500, puts buyers back in the driver’s seat. A 4-hour close below $78,500, on the other hand, brings $76,000-$77,000 into play.
Bitcoin’s Daily Uptrend Keeps Bulls in the Driver’s Seat
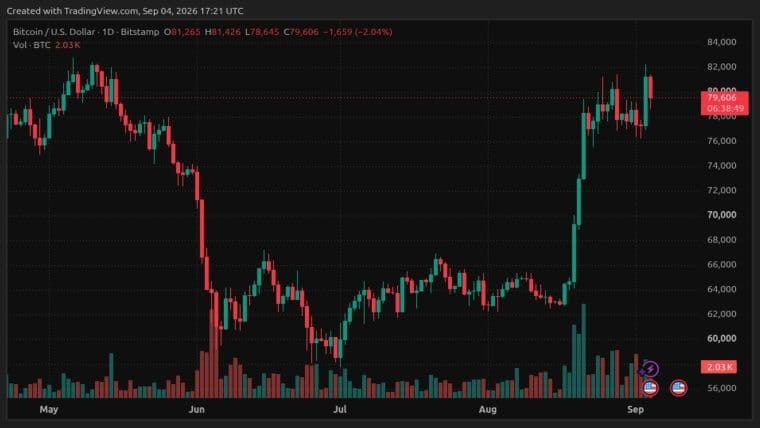
The daily chart hits different because the bigger trend remains firmly tilted toward buyers even as shorter-term momentum cools. Bitcoin’s price sits above every listed simple moving average (SMA) and exponential moving average (EMA) from 10 through 200 periods, while $80,000 acts as the first recovery hurdle.
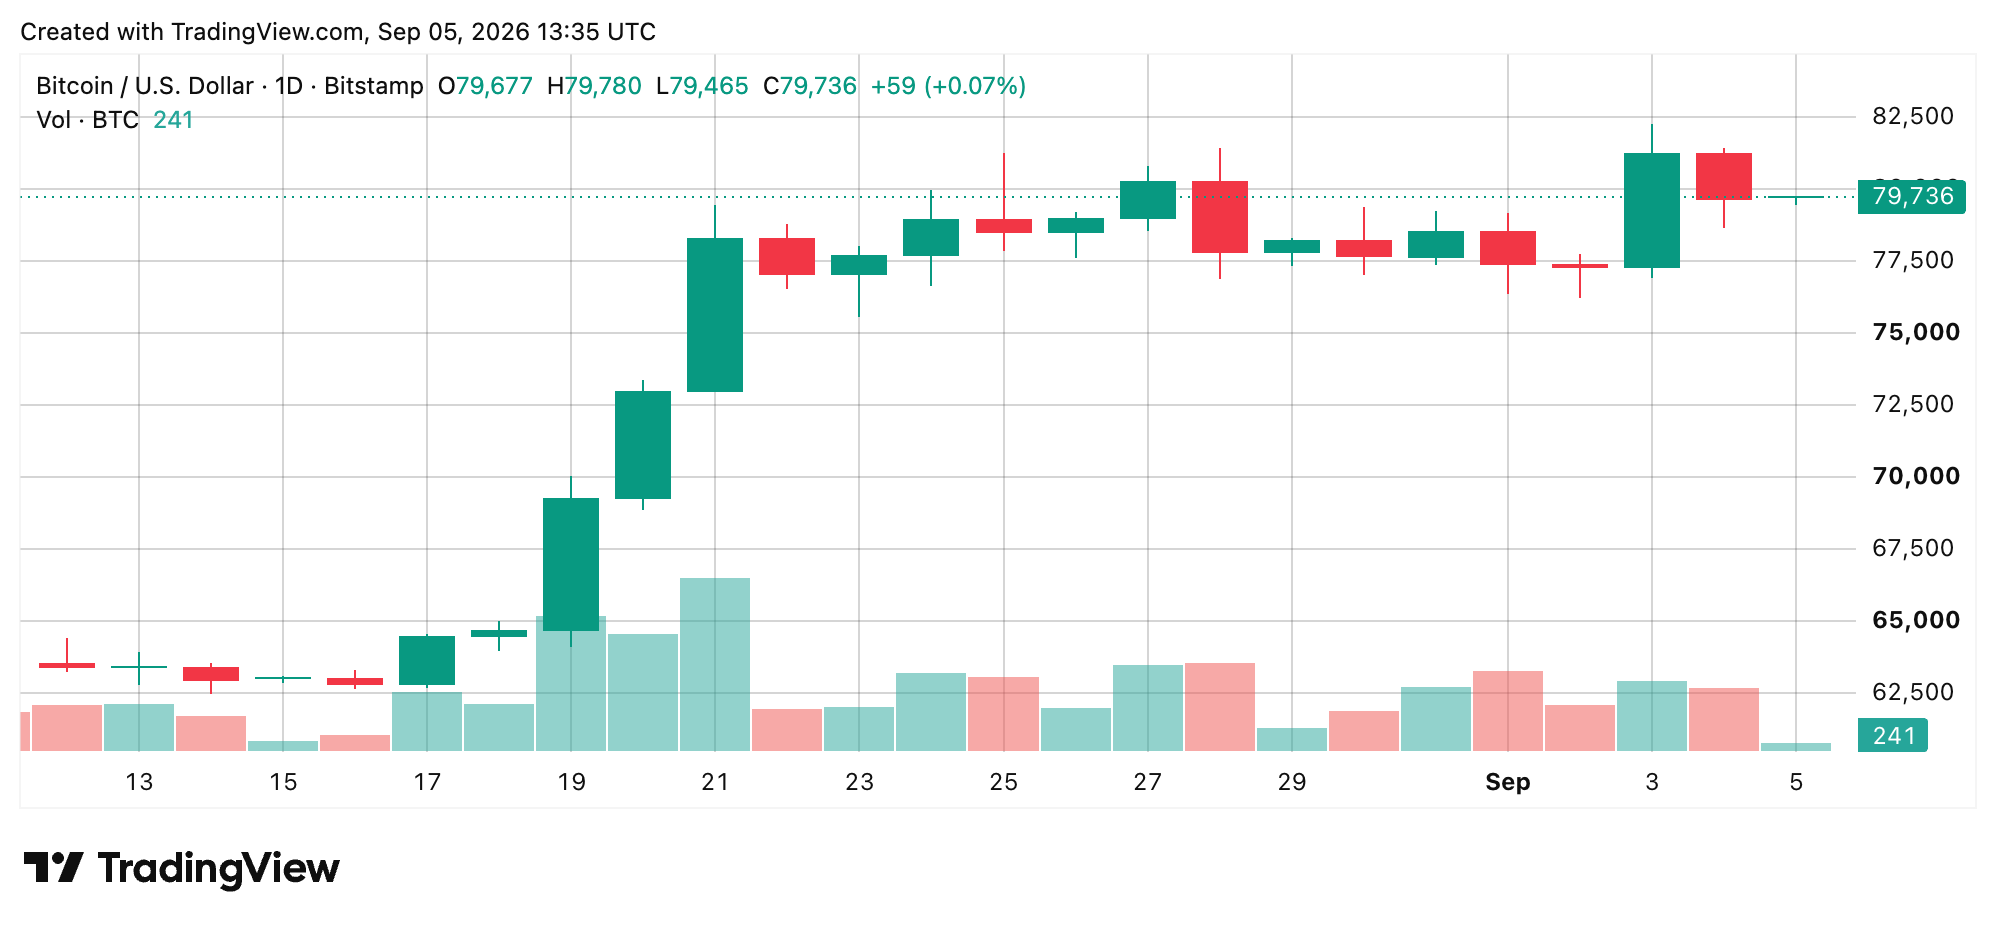
Above there, resistance stacks up around $81,250-$82,281 and then $82,800. Support sits at $78,706-$78,751, followed by roughly $78,125 and the rising 10-day MA band around $78,500-$78,800. Bulls are not out of the woods yet, though. A daily close through $81,250-$82,281 signals renewed continuation, while a sustained close below roughly $78,125 becomes a tough pill to swallow and opens $76,000 as the next deeper area.
Bitcoin’s Oscillators Show Momentum Cooling, Not Collapsing
The weekend oscillator tape is where the market starts looking a little more all over the place. The daily RSI clocks 67 this morning, the Stochastic comes in at 71, the commodity channel index (CCI) sits at 63, the average directional index (ADX) reads 46, and the Awesome oscillator (AO) registers 7,755, with each carrying a neutral, unconvincing signal this weekend.
Meanwhile, momentum at 683 and moving average convergence divergence (MACD) at 3,322 flash uglier, bearish signals. Altogether, the oscillator board logs two negatives, nine neutrals, and zero positives, producing a broad neutral reading across the board. Momentum is clearly running out of steam, but bulls are still not throwing in the towel. RSI remains below the classic overbought level of 70, while ADX at 46 indicates a trend remains present. No cap, the numbers show cooling momentum, not a confirmed trend breakdown.
Bitcoin’s Moving Averages Keep Bulls Firmly in Control
The moving-average (MA) stack is still high-key bullish, clocking 13 bullish readings, one neutral, and one bearish signal. The 10-day EMA/SMA sits at $78,503/$78,798, the 20-day pair at $76,067/$76,455, and the 30-day pair at $73,958/$72,229. Farther down, the 50-day EMA/SMA clock $71,386/$69,091, the 100-day pair sits at $69,833/$66,400, and the 200-day pair comes in at $72,563/$69,686. The Hull moving average (HMA) at $80,193 is the lone MA flashing a negative signal.
Bitcoin, sitting roughly 14% above the 200-day SMA, shows significant trend strength, but that gap also means traders chasing price are playing with fire when it comes to mean-reversion risk. For now, $78,500-$80,000 remains the main battleground. A clean push through $80,000 gets momentum picking up steam and puts $82,281 back in the cards, while sustained weakness below the range changes the vibe considerably as the dust settles.
Bull Verdict:
Bulls remain back in the driver’s seat as long as bitcoin’s price holds the $78,500-$78,800 area, with the daily moving-average stack clocking 13 bullish signals and price sitting above every listed SMA and EMA from 10 through 200 periods. A reclaim of $80,000 gets momentum picking up steam, while a daily close through $81,250-$82,281 puts a positive continuation firmly in the cards. The catch is that momentum is running out of steam right now, so buyers still need to prove they can turn that strong, longer-term structure into another push higher.
Bear Verdict:
Bears are not cooked, but they need bitcoin’s price to lose $78,500 and start putting real pressure on the $78,125 structural level. A 4-hour close below $78,500 brings $76,000-$77,000 into play, while a sustained daily close below roughly $78,125 represents the more significant warning that the bullish daily structure is starting to crack. The negative readings from momentum and MACD give bears something to work with, but they are walking a tightrope against a strong-bullish moving-average stack. Until support actually breaks, the writing’s on the wall: cooling momentum alone does not equal a confirmed bearish reversal.