Key Takeaways
- Bitcoin’s price held $78,000 support on Sept. 8 as short-term sellers retained control.
- Bitcoin’s moving averages logged ten bullish signals despite two oscillators highlighting bearish signals.
- Bitcoin must reclaim $78,800-$79,000 to weaken the short-term bearish structure.
Sellers Stall Bitcoin’s 1-Hour Rebound Below $78,800
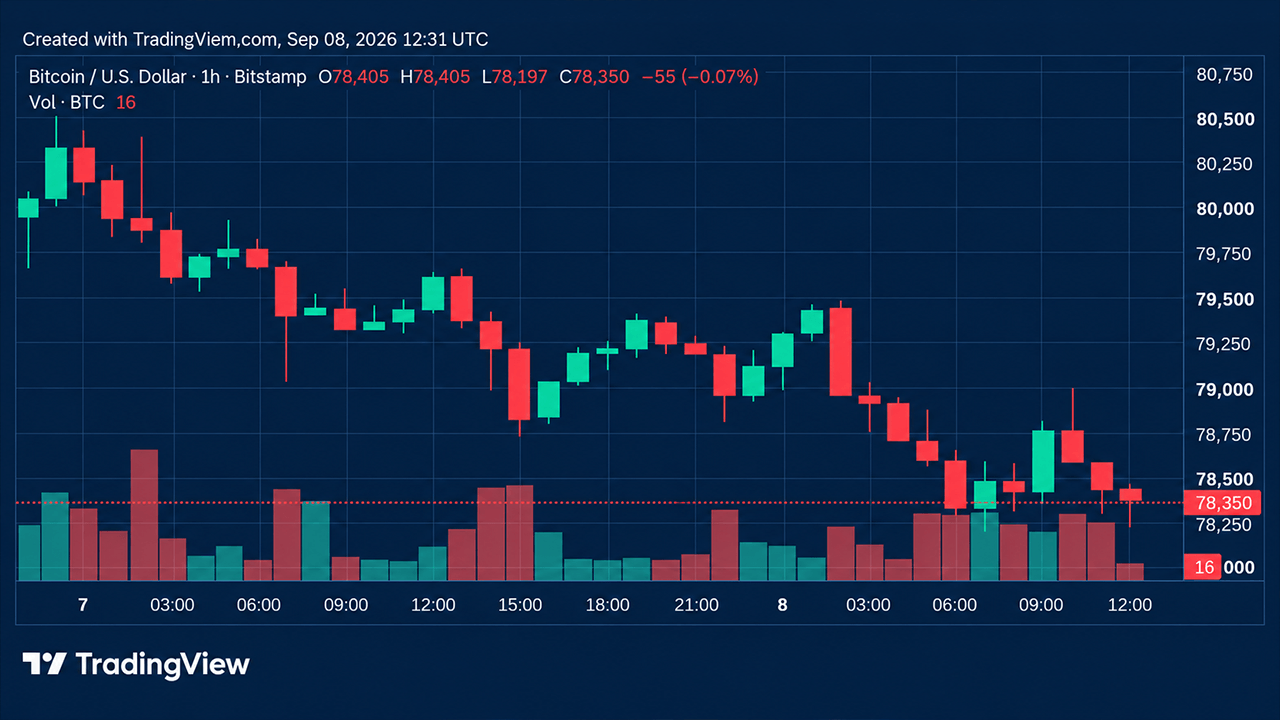
The 1-hour bitcoin price chart shows just how quickly the crazy crypto market can shift. Bitcoin bounced from a $78,170 swing low and pushed toward $78,500 before stalling, leaving short-term control with sellers unless the price can recover the $78,500-$78,800 area on rising volume.
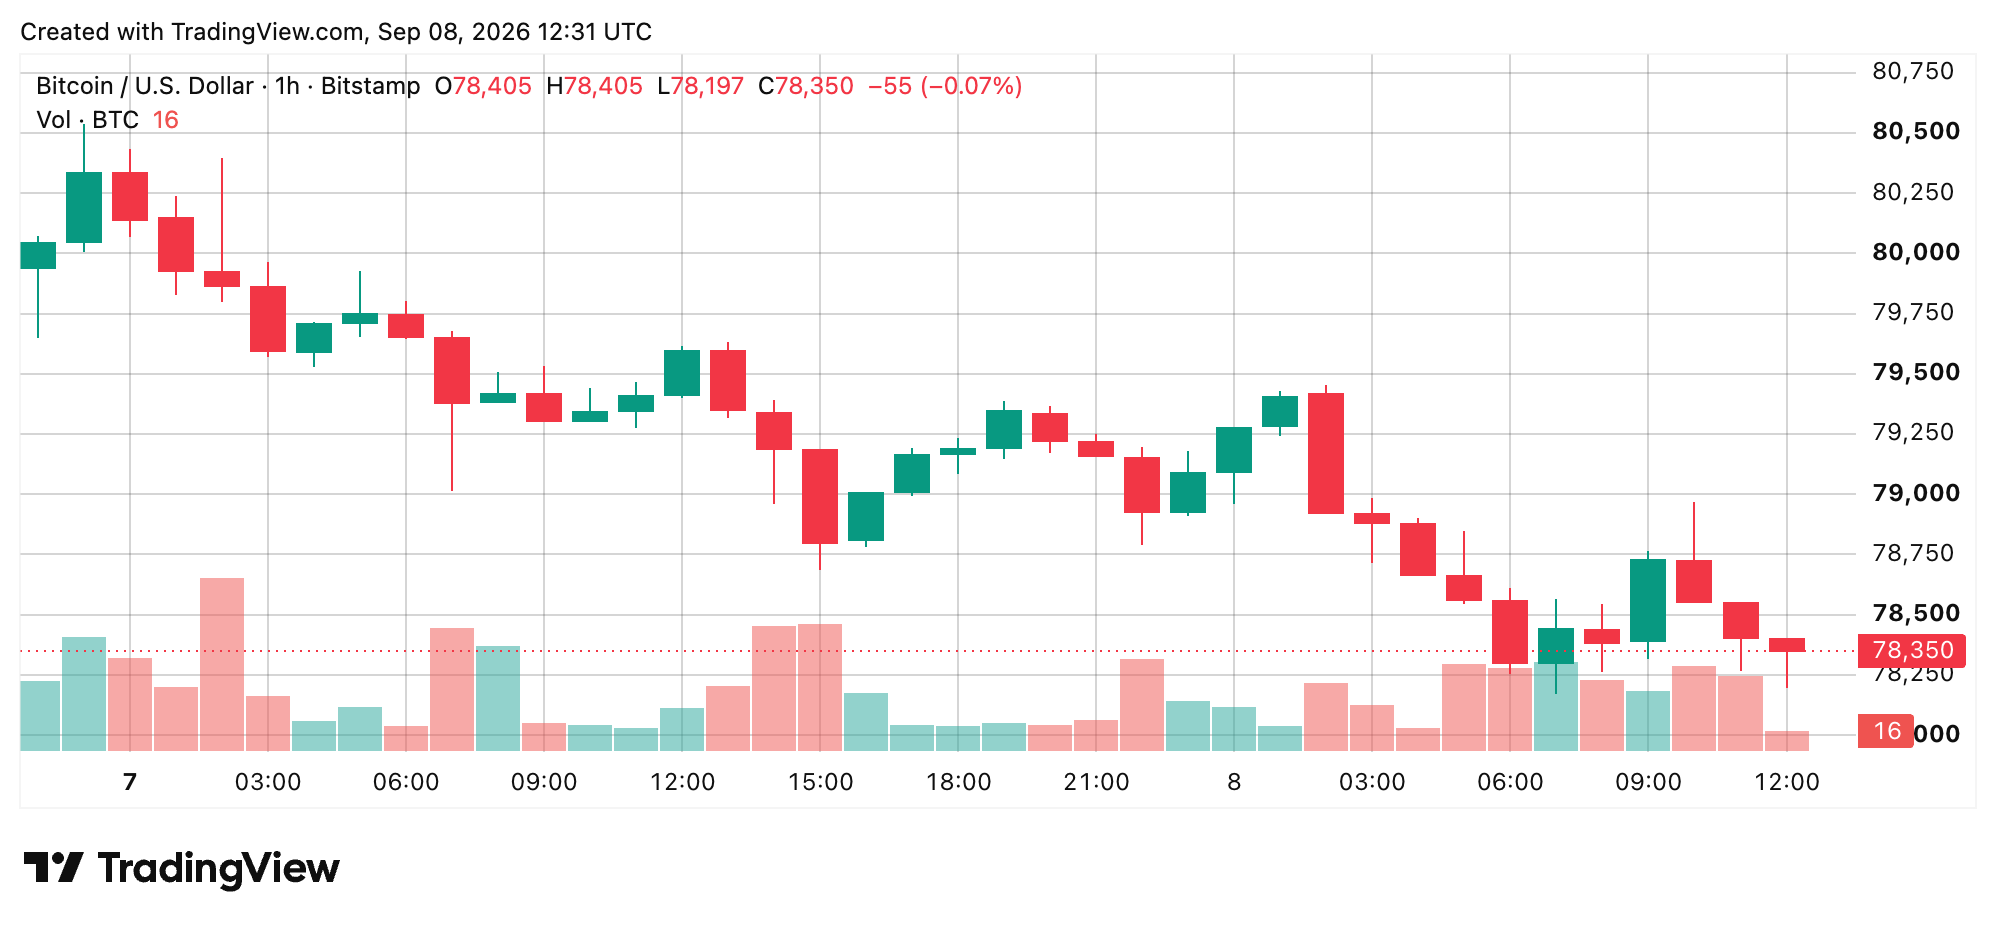
The nearby $78,170-$78,193 support zone is significant because it combines the visible swing low with the session’s $78,192.78 intraday low. A sustained move and hourly close below $78,170 would invalidate the bounce thesis.
Four-Hour Chart Keeps the Pullback Orderly
Zooming out, the 4-hour BTC price chart shows a controlled correction rather than a single sharp collapse. Bitcoin logged lower highs after retreating from the roughly $80,500 local high before testing $78,170, where buyers produced the first constructive reaction.
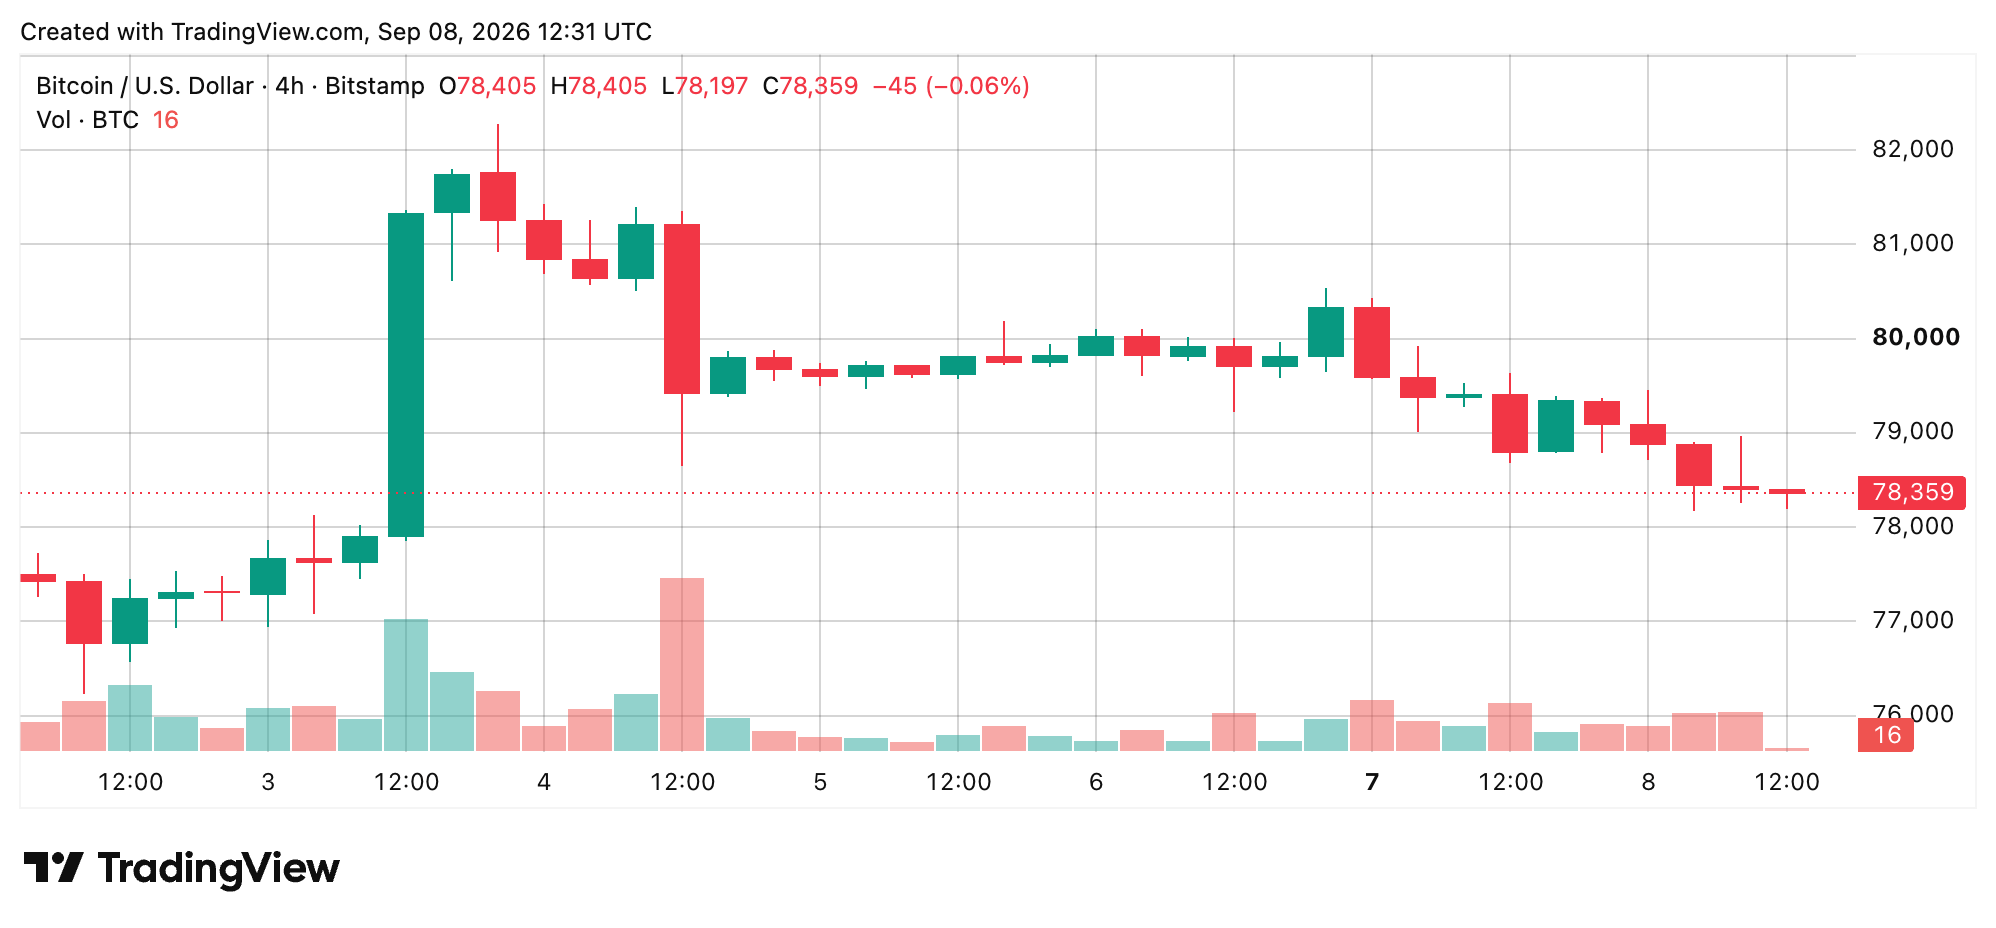
On the flip side, failure to reclaim the roughly $78,400-$78,800 moving-average cluster would keep the 4-hour structure corrective. A reclaim and hold above roughly $78,800-$79,000 would invalidate the continuation-lower thesis and put stronger resistance back in focus.
Daily Trend Survives Despite Bitcoin’s Retreat
The daily picture remains more constructive. Bitcoin was lower over the 24-hour window after failing around $79,600-$80,500, but it continued trading above its 30-, 50-, 100- and 200-period moving averages.
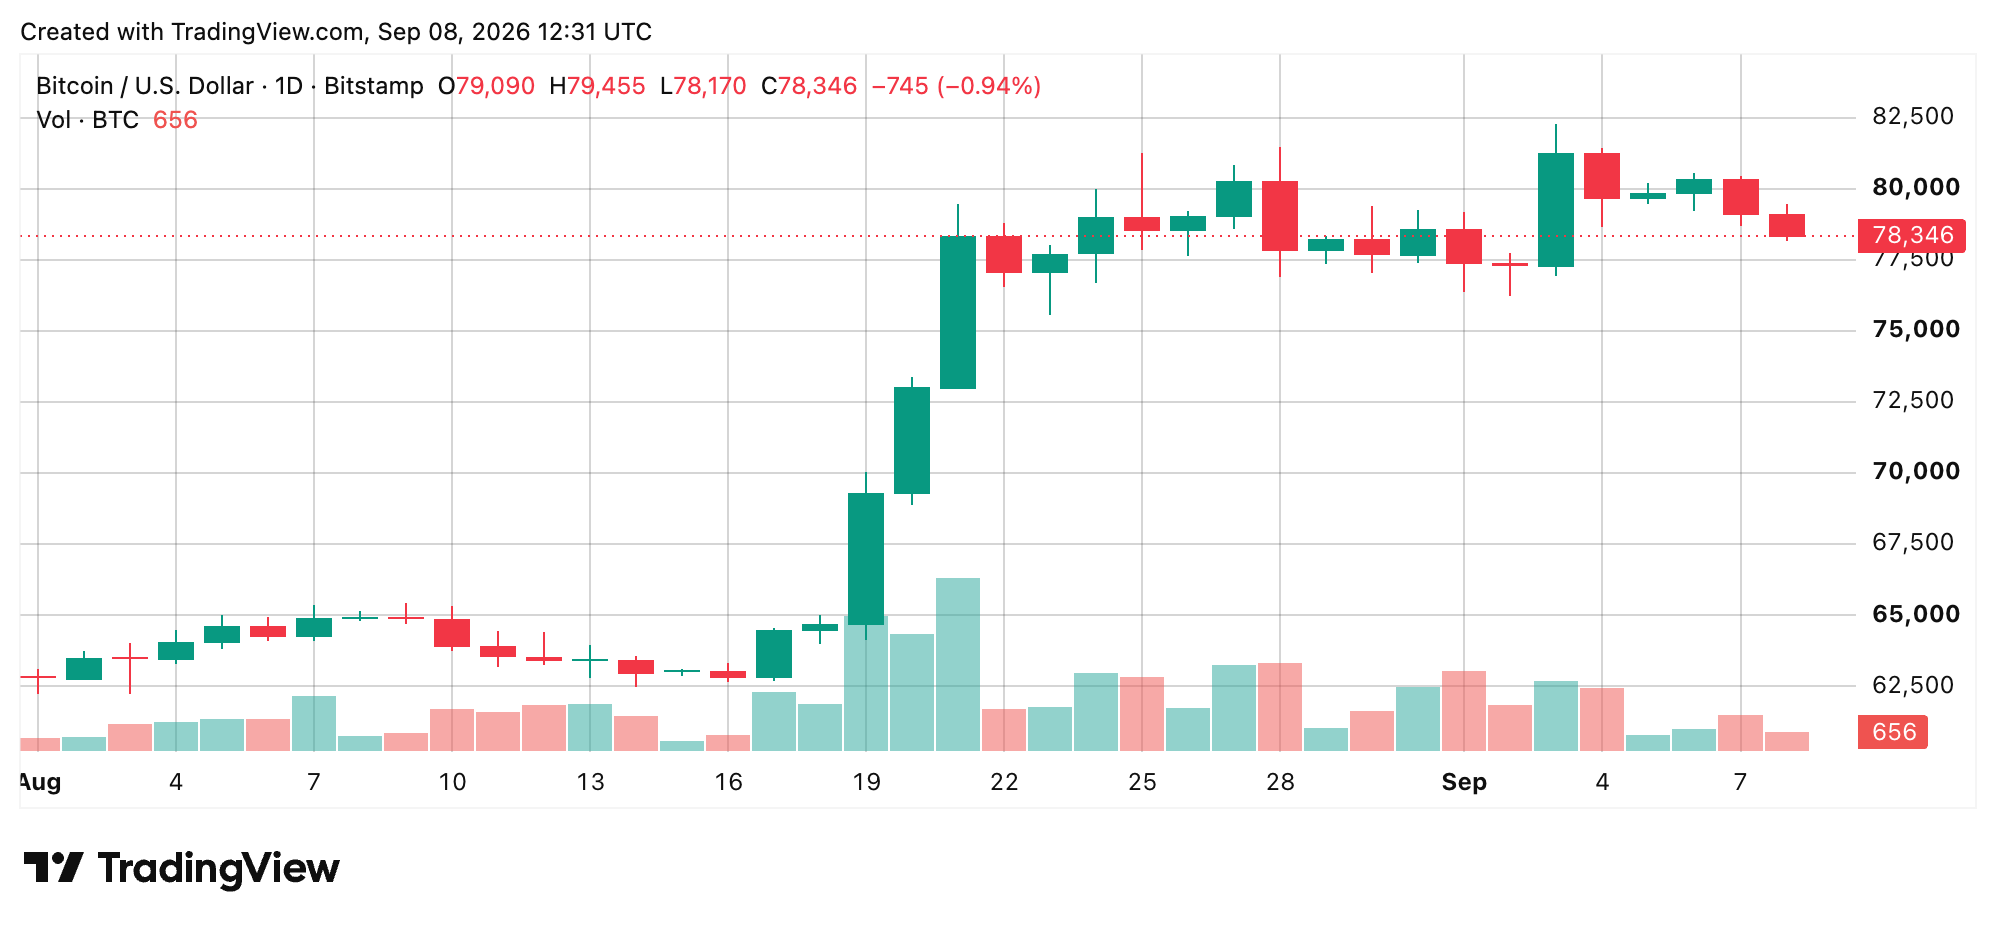
The 24-hour session also respected support in the high-$78,100 area. Funnily enough, that means the volatile land of bitcoin prices is producing two different stories at once: short-term weakness and a still-constructive broader trend. No Sept. 8 daily close had been finalized when the snapshot was taken.
Oscillators Show Momentum Is Running out of Steam
There’s a great deal of neutrality in the oscillators. The relative strength index (RSI) was 60, Stochastic at 50, commodity channel index (CCI) 22, average directional index (ADX) 48, Awesome oscillator (AO) 7,187, Stochastic RSI Fast at 5, Williams percent range minus 64, bull bear power (BBP) 971, and the ultimate oscillator (UO) at 57, all neutral readings this morning. Momentum (MOM) clocked 173, and the moving average convergence divergence level (MACD) logged 2,840, with both registering negative, bearish signals.
On Tuesday, the onchain analytics firm Glassnode described the backdrop this way in its Telegram channel: “BTC volatility is currently historically low.” Glassnoed added that long-term holder supply explains more realized volatility than market capitalization, open interest, or turnover. The researcher also remarked that bitcoin was trading differently than in March, with its 90-day correlation to the Nasdaq-100 shifting from 0.57 to 0.22 while its correlation with gold moved from 0.21 to 0.57.
Long-Term Averages Keep a Bullish Structure in the Cards
Moving averages tell a different story, logging 10 buys, four sells, and one neutral for an overall Strong Buy rating. The 10-period exponential moving average (EMA) at $78,809, 10-period simple moving average (SMA) at $78,958, 20-period SMA at $78,430, and 9-period Hull Moving Average (HMA) at $79,615 were sells. Meanwhile, the 20-period EMA at $76,892 and the 30-, 50-, 100-, and 200-period EMAs and SMAs all registered buys.
The 20-period Volume Weighted Moving Average (VWMA) at $78,136 was also a buy, while the Ichimoku Base Line at $72,375 was neutral. On the other hand, bitcoin remained below several short-term averages, meaning a clean break higher had not yet been confirmed.
What comes next is largely about the boundaries already visible on the charts. Holding $78,170 keeps a bounce in the cards, while reclaiming $78,800-$79,000 would weaken the short-term bearish structure. Resistance then sits at $79,625 and $80,537. A sustained break below $78,170 would do the opposite. Until one side takes control with volume, the evidence supports a range-bound market with longer-term strength but weaker short-term momentum.
Bull Verdict:
The bulls are still in the game. Bitcoin’s longer-term moving averages remain firmly constructive, and holding $78,170 keeps a rebound in the cards. If bitcoin’s price can reclaim $78,800-$79,000 and stay there, buyers could get back in the driver’s seat and turn their attention toward $79,625 and $80,537.
Bear Verdict:
The bears have the short-term edge, and the charts aren’t hiding it. Momentum and the moving average convergence divergence (MACD) are flashing sell signals, while bitcoin is struggling below key short-term moving averages. If $78,170 gives way, the current bounce is in trouble. On the flip side, a sustained move above $78,800-$79,000 would put the brakes on the bearish setup.