Hyperliquid’s native token HYPE surged to a new all-time high, fueled by record trading volumes and growing dominance in both spot and derivatives markets.
Summary
- Hyperliquid price hit an all-time high of $50.99 on Aug. 27, supported by record trading activity.
- The DEX continues to strengthen its position in both spot and derivatives markets.
- Growing liquidity and user adoption suggest momentum may extend if market conditions hold.
Hyperliquid (HYPE) reached a record high of $50.99 on Aug. 27 during Asian morning trading hours, extending a powerful rally that has lifted the token 22% over the past week and 14% in the last 24 hours.
According to Coinglass data, Hyperliquid’s derivatives volume climbed 14.57% in the past 24 hours to reach $3.05 billion, while open interest jumped nearly 17% to $2.33 billion, showing a rise in speculative positioning.
At the same time, more than $1.76 million worth of short positions were liquidated, suggesting that traders betting against the rally were caught off guard by the breakout.
The milestone comes as trading activity and decentralized exchange metrics surrounding the platform continue to accelerate.
Hyperliquid’s rising DEX metrics
The surge follows Hyperliquid’s Aug. 26 update that spot trading volumes on the exchange hit a record $3.4 billion in a single day, largely fueled by Bitcoin (BTC) and Ethereum (ETH) markets. With $1.5 billion in daily BTC spot volume alone, the platform is now the second-largest venue globally for Bitcoin spot trading across both centralized and decentralized markets.
Supporting this trend, DefiLlama data shows that monthly decentralized exchange volumes on Hyperliquid have already exceeded $18 billion in August, surpassing July’s $11 billion. Meanwhile, total value locked on the platform has reached $721 million, another all high. Annualized revenue is also running at $1.26 billion, demonstrating the protocol’s expanding footprint.
Hyperliquid technical analysis
The price chart shows a clear breakout above resistance at $49 with higher volumes and a relative strength index reading of 61, suggesting that momentum is increasing without going into overheated territory. Expanding Bollinger Bands suggest higher volatility, and short- to long-term moving averages are still skewed upward.
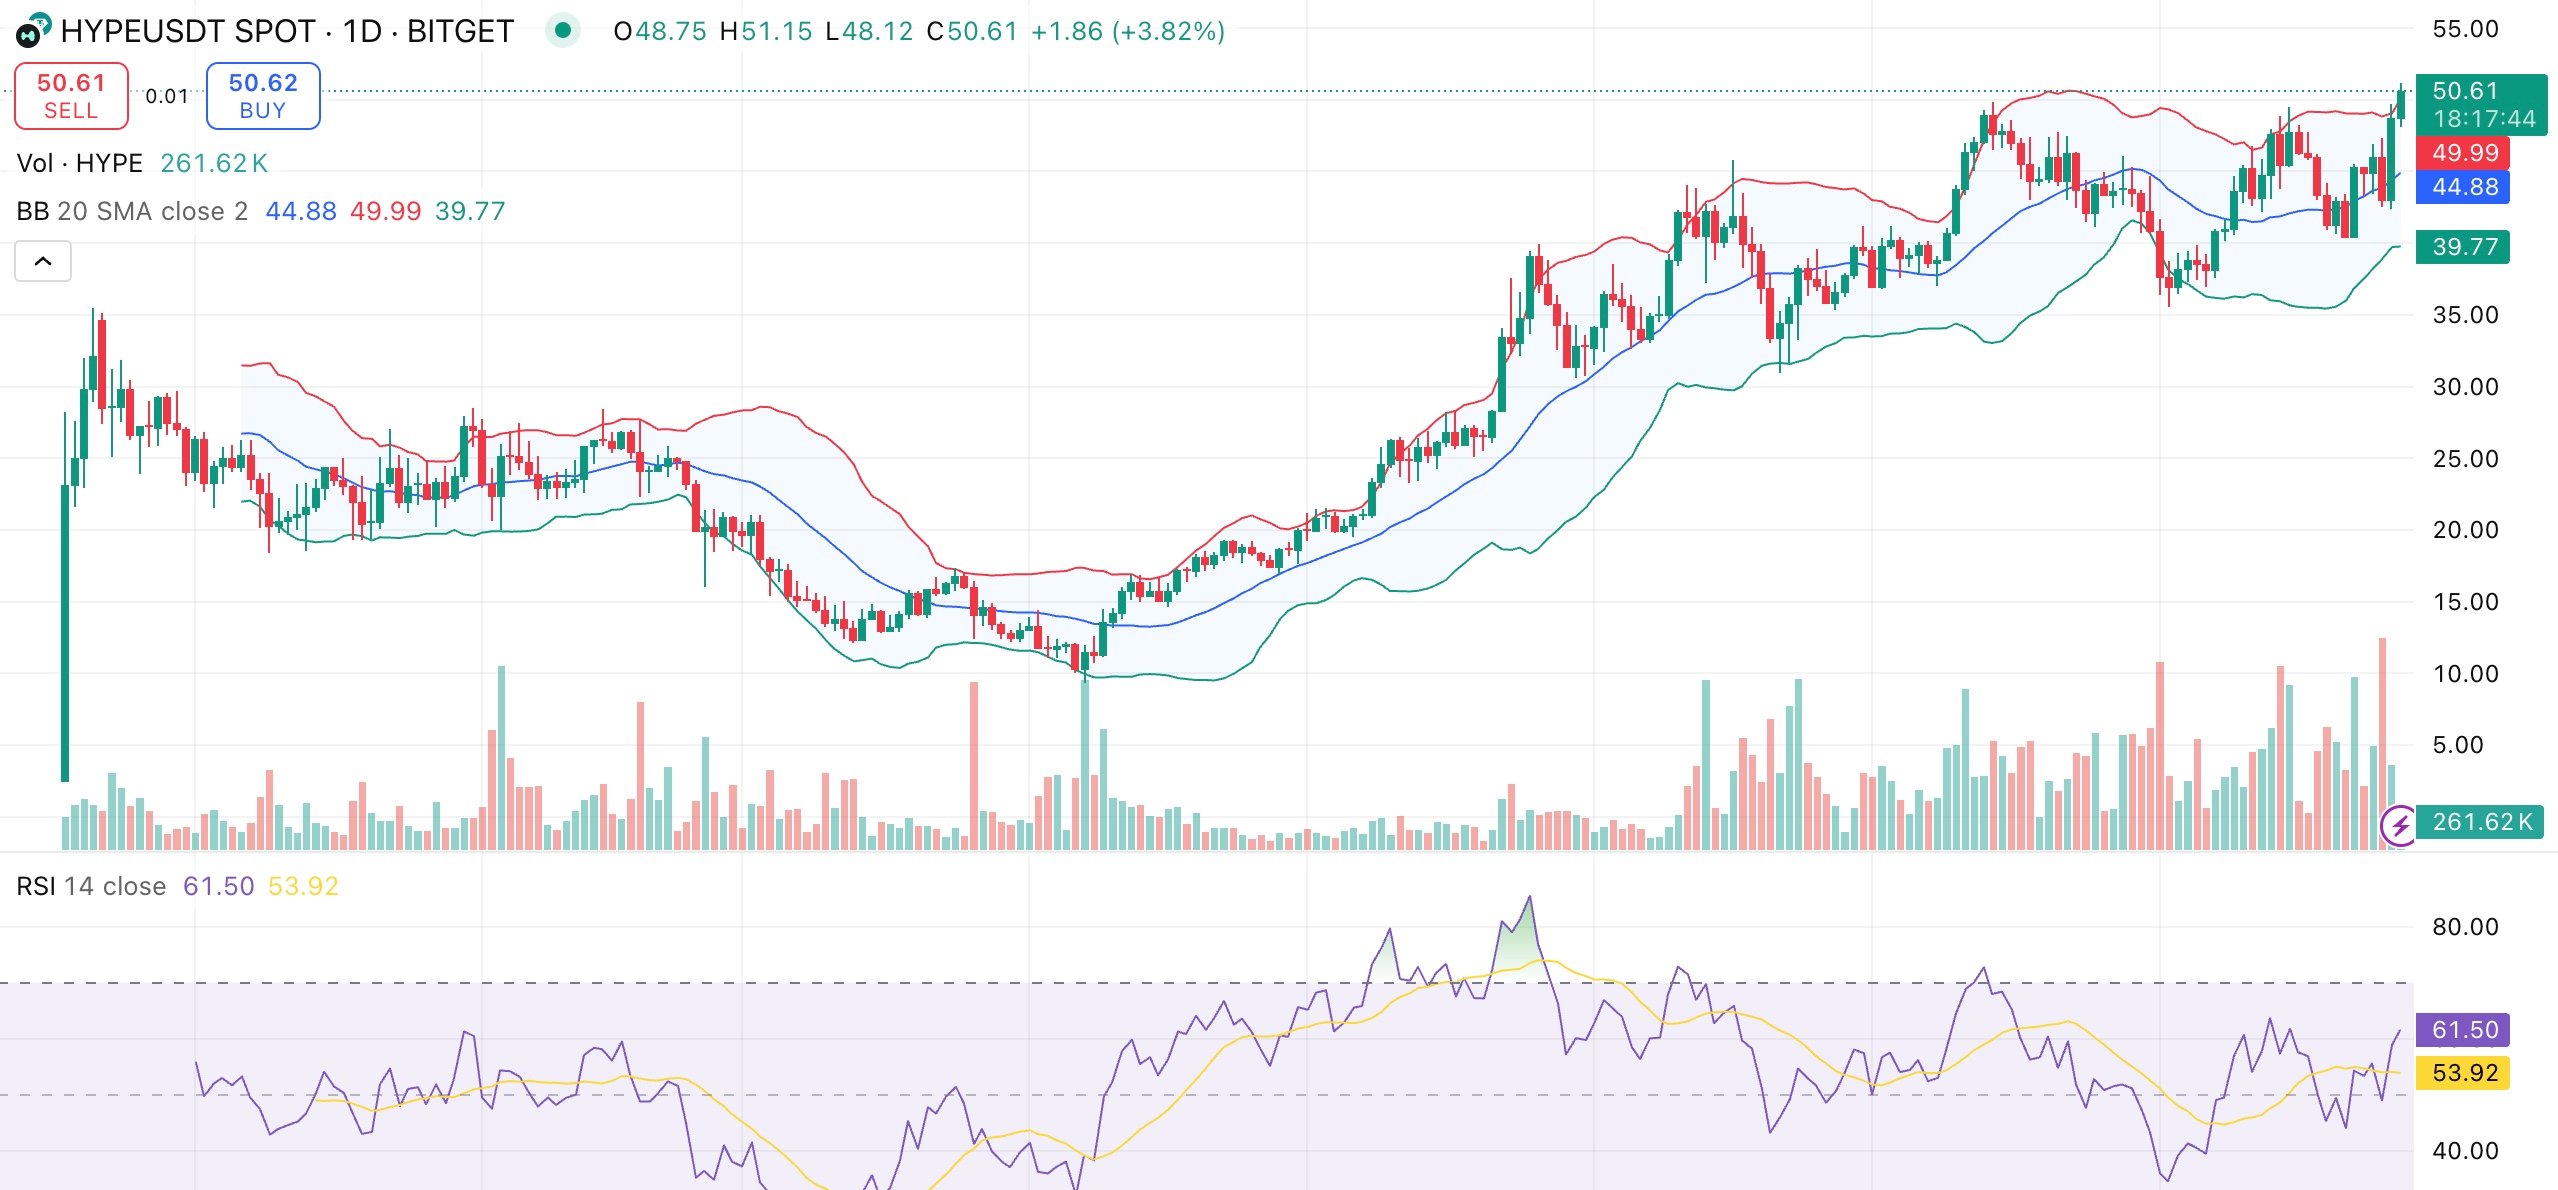
The Commodity Channel Index at 195 indicates significant upward pressure, and the moving average convergence divergence indicator has flashed a buy signal after crossing into positive territory.
The next resistance might appear around $55, if HYPE maintains support above $50. But if traders start taking profits, a drop back towards $45 would not be unusual.
