Bitcoin just dropped 24% from its all-time high — what happens next? Analysts say BTC is “very close to its local bottom,” but could a Black Swan event send it crashing even lower?
Macro turmoil shakes Bitcoin
Bitcoin’s (BTC) price has been on a bumpy stretch. After hitting an all-time high of $109,114 in January when President Donald Trump took office and established a more pro-crypto administration, the market has taken a sharp turn.
As of Mar. 13, Bitcoin is sitting around $82,600, down 24% from its January peak, after plunging to a four-month low of $76,600 on Mar. 11.

The market is facing headwinds from multiple directions. Wall Street is leaning into risk aversion, U.S. recession fears are growing, and Trump’s new tariff policies have added uncertainty to the mix.
Many investors were also disappointed by the lack of fresh BTC purchases under the Trump administration’s strategic reserve plan, which some had hoped would provide a steady buying force for Bitcoin.
On the macroeconomic side, inflation data released on Mar. 12 offered a brief moment of optimism. The consumer price index rose by just 0.2% in February, slowing to an annual inflation rate of 2.8% — down from 0.5% in January. The core CPI, which strips out food and energy prices, also landed at 3.1%, its lowest level since April 2021.
The market initially reacted positively to the softer CPI data. Bitcoin pushed above $84,000, and altcoins saw double-digit gains. The S&P 500 and Nasdaq 100 also recorded slight upticks.
But the optimism didn’t last. As the day progressed, BTC and equities erased most of their gains, weighed down by Trump’s tariff war escalating against major trading partners.
In a dramatic move, Trump slapped a 25% tariff on steel and aluminium imports from Canada, prompting Canada to retaliate with 25% tariffs on $21 billion worth of U.S. goods.
Just hours later, the EU fired back with its own $28 billion in retaliatory tariffs on U.S. products, further intensifying trade tensions.
These actions have put investors on edge, shifting market sentiment toward a risk-off approach, where cash and safer assets like gold and bonds become more attractive than volatile plays like Bitcoin.
With all these forces at play, Bitcoin finds itself at a crossroads. Will it stabilize and gear up for another run, or are further corrections on the horizon? Let’s dig deeper.
Institutional money retreats
Since Feb. 13, spot Bitcoin ETFs have been under pressure, with money flowing out at an aggressive pace. While there were a few days of net positive inflows, they were small in volume compared to the heavy outflows on most days.
The worst hit came on Feb. 25, when ETFs saw their largest single-day outflow ever — over $1 billion, marking a clear risk-off sentiment among institutional investors.
Despite the outflows, as of Mar. 12, BlackRock’s IBIT remains the dominant ETF in the market, holding nearly 568,000 BTC. Fidelity’s FBTC and Grayscale’s GBTC follow, managing 197,500 BTC and 196,000 BTC, respectively.
Adding a political layer to the Bitcoin narrative, at least six members of President Trump’s cabinet hold Bitcoin, either directly or indirectly through ETFs.
Among them, Health and Human Services Secretary Robert F. Kennedy Jr. has the largest disclosed stake, with a Bitcoin Fidelity crypto account valued between $1 million and $5 million.
Treasury Secretary Scott Bessent holds between $250,001 and $500,000 worth of BlackRock’s iShares Bitcoin Trust ETF. While Bessent has pledged to divest his holdings within 90 days, his position highlights the growing connection between Bitcoin and top-level U.S. policymakers.
Meanwhile, Bitcoin’s open interest, a crucial metric showing the total value of outstanding BTC derivative contracts, has been in a downward spiral.
After peaking at $70 billion on Jan. 22, following Bitcoin’s new all-time high, open interest has been on a steady decline. As BTC tumbled, OI followed, dropping to a low of $45.7 billion on Mar. 11, the same day BTC hit its four-month low.
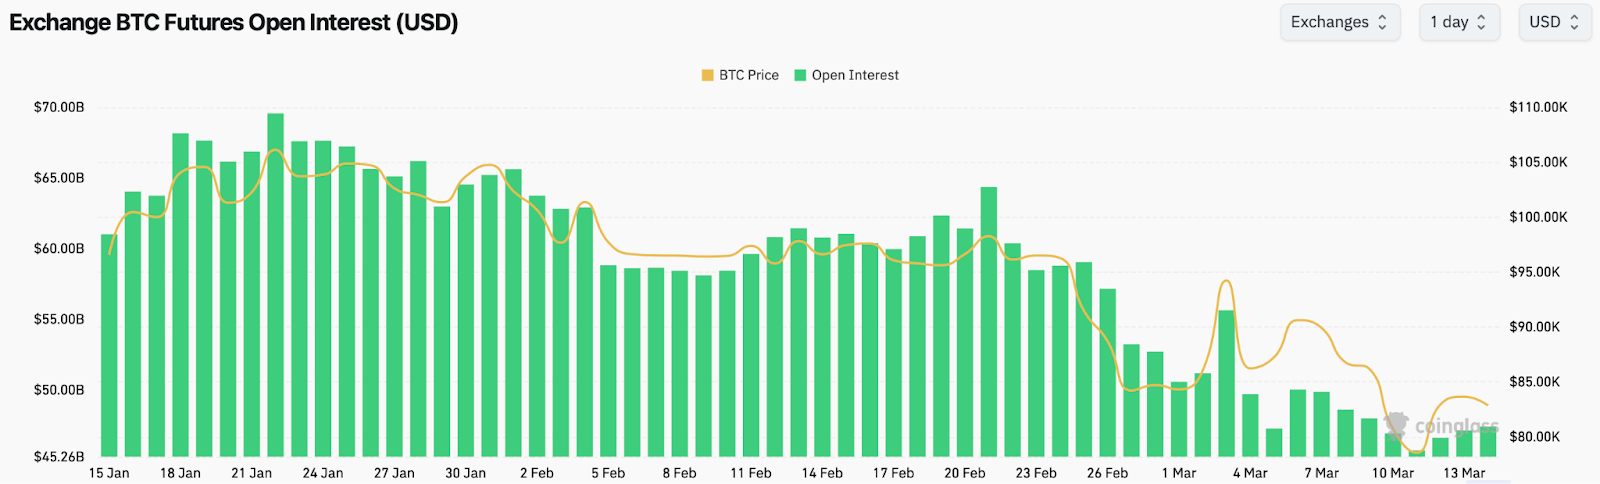
However, in the last two days, open interest has started climbing back, adding over $1 billion as of Mar. 13, in sync with BTC’s price recovery.
The heavy ETF outflows and dropping open interest paint a picture of institutional hesitation and reduced speculative activity over the past few weeks.
Bitcoin’s rally in January was fueled by strong ETF inflows and high-leveraged positions, but as soon as macro uncertainty and Trump’s trade war escalated, the market turned defensive.
The latest open interest rebound is a potential signal that traders are cautiously re-entering long positions, but the recovery is slow. A sustained increase in both OI and ETF inflows will be critical for Bitcoin to regain momentum.
History hints at a rebound
Bitcoin’s recent pullback from its all-time high has been sharp, but historical trends and technical indicators suggest that this could either be a temporary bottom or the beginning of a deeper correction.
Technical analyst CryptoCon points out that Bitcoin has now reached historically low RSI Bollinger Band % levels, a point where BTC rarely stays for long.
To break this down — Relative Strength Index measures momentum, while Bollinger Bands show volatility. When the RSI Bollinger % reaches extreme lows, it suggests that Bitcoin is at an oversold level, meaning the downside pressure is likely exhausting itself.
In previous cycles, when BTC hit similar RSI Bollinger % lows, it marked a strong local bottom before the next leg up.
According to CryptoCon, Bitcoin has just completed Phase 4, a part of the market cycle where price breaks past the previous all-time high—something we saw in January 2013, December 2016, and November 2020.
In all three of these cycles, BTC had a correction after the breakout before rallying to a new high within the next 9 to 12 months.
He believes that this market cycle is behaving exactly like March 2017, when BTC faced a deep correction but then recovered to rally further. If that’s the case, this means we are still months away from a cycle top.
However, this optimistic outlook is far from universally accepted. Doctor Profit, another respected analyst, lays out two possible scenarios for BTC’s next move.
There are two scenarios:
A) Bottom to be 68-74k region in normal market
B) Full crash towards 50k in Black Swan eventTake your bets, I would say that a Black Swan event was very unlikely in the last few months, but ask me now, I would not rule it out, rather welcome it.
— Doctor Profit 🇨🇭 (@DrProfitCrypto) March 13, 2025
In a normal market environment, BTC’s local bottom should form between $68,000 and $74,000, as confirmed by the Market Value to Realized Value indicator.
The MVRV indicator measures whether Bitcoin is overvalued or undervalued by comparing the current market price to the average purchase price of all BTC in circulation.
Right now, the MVRV suggests that BTC is approaching a strong bottom zone, meaning downside risk is limited unless something drastic happens.
That’s where the Black Swan risk comes in. While Doctor Profit initially believed a Black Swan event was highly unlikely, recent economic shifts — such as Trump’s aggressive tariff moves, global trade war concerns, and broader recession fears — make him less certain.
A severe global economic downturn, a financial crisis, or a major crypto industry collapse could push Bitcoin much lower, possibly toward $50,000. While he still leans toward the first scenario, he no longer rules out a full-blown market wipeout.
The signs are mixed. Bitcoin’s historical cycles suggest this is a healthy pullback before another rally, but global conditions have rarely been this unstable.
For now, investors should stay cautious, watch key support levels, and be prepared for heightened volatility.
While historical data favors a recovery, markets don’t move in a vacuum, and external shocks can override even the strongest technical indicators. Never invest more than you can afford to lose.
Disclosure: This article does not represent investment advice. The content and materials featured on this page are for educational purposes only.
