Key Takeaways
- Bitcoin fell 2.8% Friday as Coinglass logged $577.9M in crypto liquidations.
- Sosovalue data showed $36.29M leaving spot bitcoin ETFs during Friday trading.
- Donald Trump warnings and Fed fears kept BTC below the $76K resistance zone.
Bitcoin Loses Ground
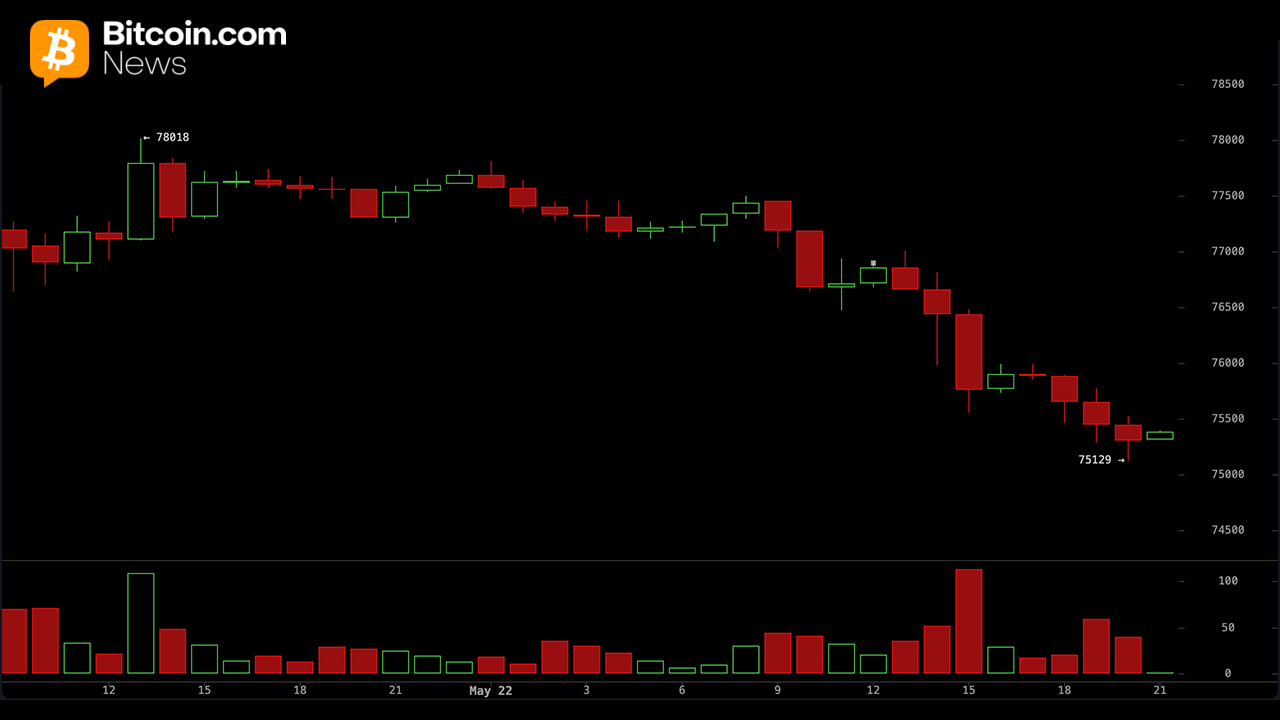
The $80,000 range once again appears increasingly distant, with bitcoin now trading below the $76,000 zone after surrendering support at $77,000. Bitcoin’s daily structure continues to reflect a market searching for conviction following the extended retracement from its October 2025 all-time high above the $126,000 range. Bitcoin’s market cap currently sits at $1.5 trillion, while Friday trading volume remained relatively light at $31.49 billion, adding to the market’s instability.
The volume that has emerged throughout the session appears heavily tilted toward sell-side pressure. Headwinds continue to build from escalating geopolitical tensions in the Middle East and warnings directed at Iran by U.S. President Donald Trump. At the same time, broader macroeconomic conditions and shifting Federal Reserve expectations remain in focus, particularly as the central bank enters a new leadership phase that many market participants believe could lean hawkish. Adding further strain, exchange-traded funds (ETFs) have recorded a series of outflows throughout the week.
Friday’s trading session logged roughly $36.29 million exit spot bitcoin ETFs, according to sosovalue.com data. Persistent negative funding rates, repeated failed breakouts above the $76,000 range, and ongoing deleveraging across futures markets further intensified the decline. Over the past 24 hours, bitcoin long positions accounted for $209 million in liquidations, while short positions absorbed just $4.7 million in losses. Across the broader crypto economy, total liquidations reached $577.9 million, according to stats from coinglass.com.

Moving averages remain the clearest source of bearish pressure across the technical picture, with 13 indicators signaling downside conditions compared with just one supportive reading. The momentum oscillator delivered one of the few constructive signals among the oscillator set at -4,072, while the moving average convergence divergence ( MACD) registered -262, reinforcing that bearish momentum continues to dominate the broader intraday trend.
The combination of weakening technical structure, persistent ETF outflows, elevated liquidations, and mounting macroeconomic uncertainty paints an increasingly defensive picture for bitcoin in the near term. Unless bulls reclaim key resistance levels and reverse the current pattern of failed breakouts, bearish sentiment appears firmly in control as traders continue reducing exposure amid intensifying market pressure.
As it often does, bitcoin is once again acting as a barometer for global liquidity conditions and geopolitical stress well before traditional finance (TradFi) markets fully react when trading resumes Monday morning. The contrast stands out even more given that bitcoin’s Friday evening decline unfolded while Wall Street closed the session at fresh record highs.
