XRP trades near $1.85 as a rare 3-week Stochastic RSI signal reappears, pointing to slowing sell pressure and range-bound price action.
XRP continues to trade under pressure as crypto markets remain unsettled toward the end of the year. While short-term price movement stays weak, several long-term and momentum-based signals suggest that selling pressure may be slowing rather than increasing.
Long-Term Indicator Reaches Rare Level
A technical signal has appeared on XRP’s 3-week chart that has been seen only once before. Analyst Steph Is Crypto said,
“On the 3-week timeframe, the Stochastic RSI has dropped to 0.”
Remarkably, this level last appeared during the 2022 bear market bottom. On higher timeframes, the Stochastic RSI rarely reaches zero. When it does, it usually follows a long period of steady selling.
Analysts view this condition as a sign that sellers may have exhausted their momentum. It does not point to a quick rebound, but it suggests that further sharp downside may be limited.
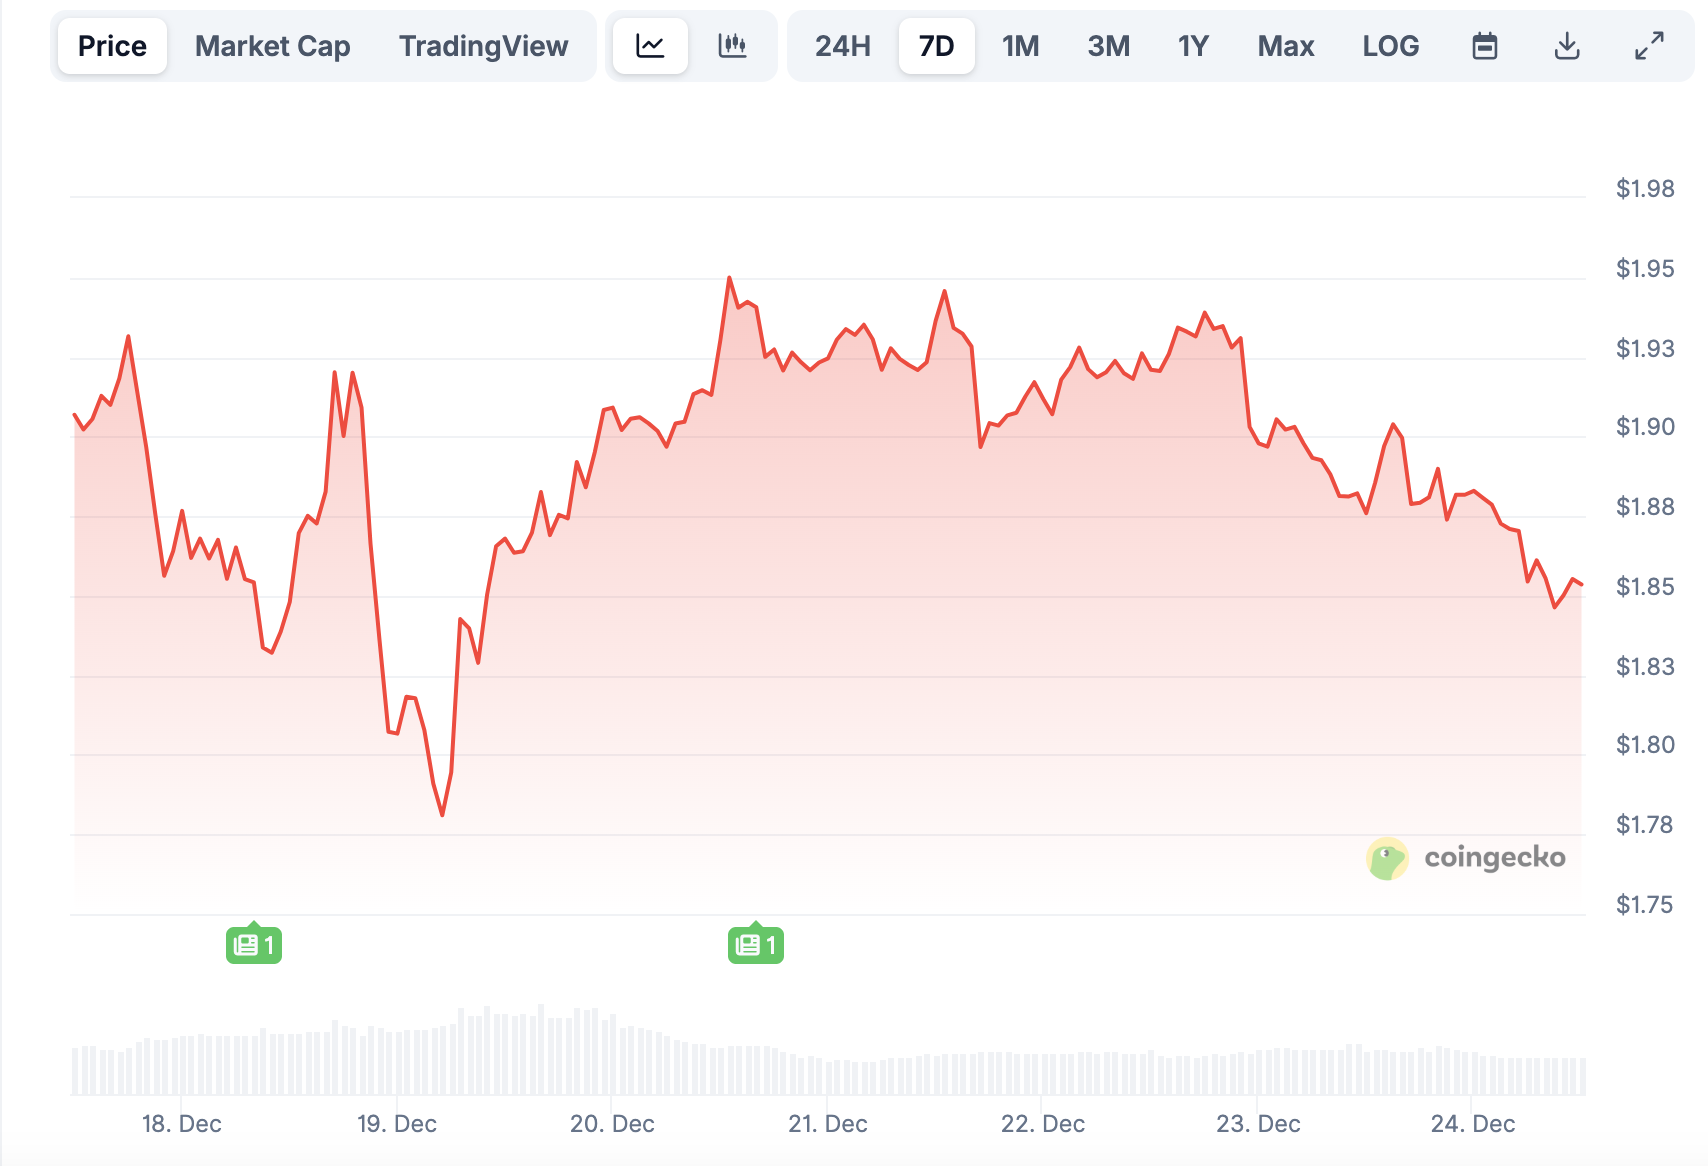
XRP is trading near $1.85 at press time (per CoinGecko data). The price action remains inside a broader range instead of pushing to fresh lows. This behavior matches the pattern seen after the 2022 low, when XRP moved sideways for months before any sustained recovery.
Meanwhile, recent trading shows the asset losing short-term support near $1.90. Sellers were active at that level, shifting focus to the $1.85 and $1.82 zones. Volume increased during attempts to move higher, suggesting supply entered the market near resistance.
Despite this pressure, XRP has not seen aggressive selling or sharp breakdowns. Price movement points to stabilization rather than panic. Market activity suggests that long-term holders may be absorbing supply instead of exiting positions.
You may also like:
The broader crypto market remains a key factor. Bitcoin continues to guide overall direction, while thin liquidity during the holiday period has increased short-term price swings across major assets.
Bullish Divergence Forms on Daily Timeframe
On the daily chart, momentum indicators are sending early warning signs. ChartNerd noted that,
“$XRP’s daily bullish divergence is still building.”
The asset continues to form lower lows, while the RSI shows higher lows. This setup indicates that downside momentum is weakening. The divergence has developed across multiple price swings, which often increases its reliability.
However, the token remains below a descending trendline, keeping the short-term trend pointed lower. Until it breaks above that resistance, the divergence remains unconfirmed. It signals slowing sell pressure rather than a completed trend change.
Sideways Movement Expected Near Key Levels
CryptoWZRD expects XRP to trade within a defined range in the near term. The analyst stated that “more sideways movement is likely, particularly between $1.82 and $1.98.” Daily candles have closed without a clear direction as Bitcoin applies pressure.
Since liquidity is low, intraday charts have minimal momentum and exhibit random volatility. Resistance is close to $1.97, and the support is close to $1.82.
Market sentiment around XRP has turned cautious. Data from Santiment shows that similar sentiment shifts have often occurred near periods of price stabilization rather than extended declines.
SECRET PARTNERSHIP BONUS for CryptoPotato readers: Use this link to register and unlock $1,500 in exclusive BingX Exchange rewards (limited time offer).
