Ethereum retreated and entered a technical correction as demand from American investors eased and the crypto market continued to crash following the introduction of tariffs on top US partners.
Summary
- Ethereum token has moved into a technical correction after falling by 12% from the July high.
- Demand for spot Ethereum ETFs as started to wane in Wall Street.
- Technical analysis points to a brief downside before an eventual rebound.
Ethereum ETF demand wanes
The Ethereum (ETH) price crashed by over 12% from its highest point in July as demand for ETFs waned. SoSoValue data shows that these funds had net outflows of $152 million on Friday, Aug. 1, ending a prolonged streak of inflows started on July 3.
Ethereum ETF inflows have been ongoing for the past twelve consecutive weeks, the longest streak since their approval. However, the weekly trend seems worrying as they added $154 million this week, down from $1.85 billion last week and $2.1 billion before that.
Ethereum ETFs have had cumulative inflows of $9.5 billion since their approval, bringing the total assets under management to over $20 billion. BlackRock’s ETHA ET has $10.7 billion, and is followed by Fidelity’s FETH.
The same demand dynamics are happening among Bitcoin (BTC) ETFs, which shed $812 million in assets on Friday and $114 million on Thursday.
Ethereum price crash coincided with the broader crypto market weakness as Trump started his tariffs, and after the U.S. released weak nonfarm payroll data.
On the positive side, Ethereum has some solid fundamentals. For example, the total stablecoin supply in its ecosystem increased by 5.4% over the last 30 days to $136 billion, while the adjusted transaction volume rose by 50% to $740 billion.
The same growth occurred in the decentralized finance industry, where the total value locked in its ecosystem increased by 27% over the last 30 days to $171 billion.
Also, Ethereum Treasury Companies have continued to accumulate. Tom Lee’s Bitmine Immersion now holds tokens worth $2 billion, while SharpLink has $1.48 billion. All these treasury companies hold ETH worth $4.92 billion, which is equivalent to 1.16% of the total supply.
Ethereum price technical analysis

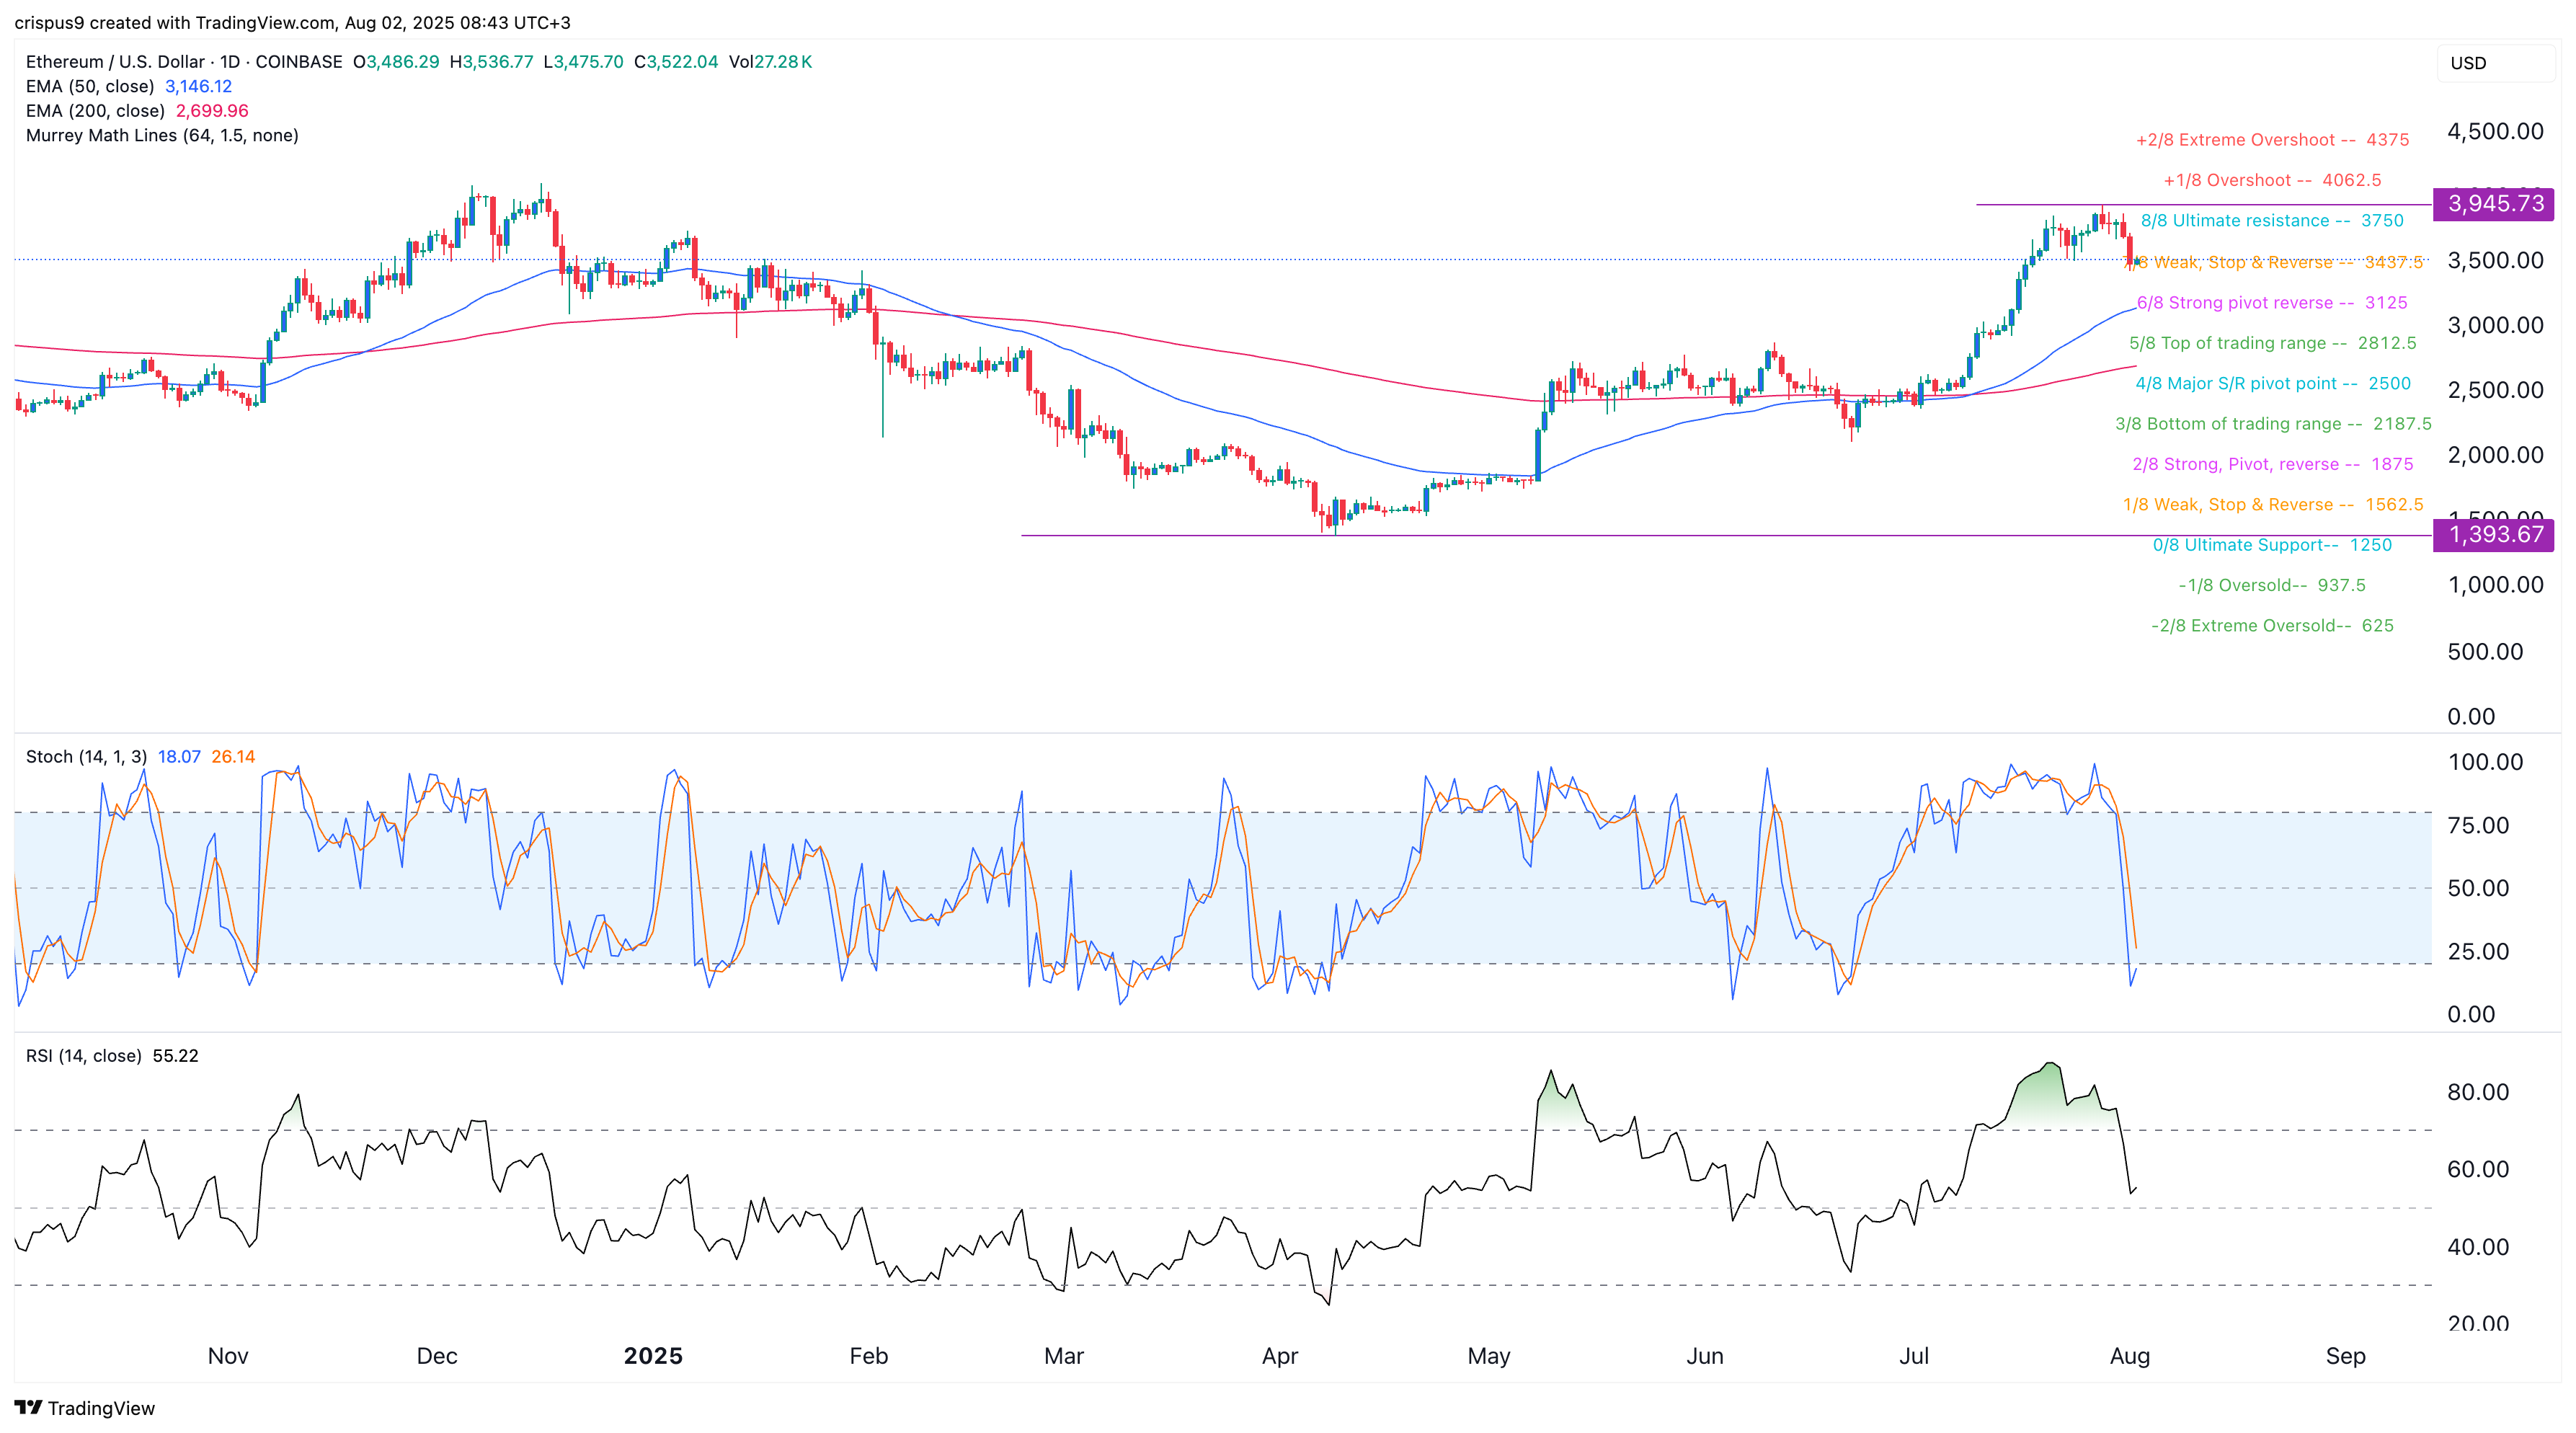
The daily chart indicates that the Ethereum price has been in a strong uptrend since bottoming at $1,393 in April of this year. It reached a high of $3,945 in July, moving closer to its previous year’s highest point.
The coin pulled back and moved to the weak, stop-and-reverse point of the Murrey Math Lines. Top oscillators, such as the Relative Strength Index and the Stochastic, have all pointed downward.
Therefore, the ongoing mean reversion may push it to the strong pivot reverse point at $3,125, which coincides with the 50-day moving average. It will then bounce back and possibly hit $4,000 this month as many Polymarket traders expect.
